The short version: Ask for a deck, get a file. Your own PowerPoint template is tokenized once; the agent computes the values, fills every placeholder in one strict pass, generates the chart into the slot the template reserved for it, and saves a real
.pptx. The run this post is written from produced six slides with zero placeholders left when the file was reopened. The charts arrive as images rather than editable PowerPoint chart objects, and the reason for that is the most useful thing on this page.
Finance teams do not deliver dashboards to a board. They deliver a deck.
That gap is where most reporting automation quietly stops. The tooling gets you to a number, a chart, a well-written paragraph of commentary — and then someone opens last quarter's PowerPoint, retypes the number, re-crops the chart, and re-checks that the footer still says the right thing. The last mile is manual, it happens under time pressure at the end of the close, and it is exactly where a wrong figure gets in.
This is a walkthrough of that last mile being closed properly: what actually comes out, how your own design survives it, and the two places where the honest answer is a limit rather than a feature.
The deliverable is a .pptx, and that is the whole problem
A board pack has requirements that have nothing to do with analytics.
It has to be a file, because it gets emailed, printed, annotated in the meeting and filed afterwards. It has to be your file — your grid, your typeface, the confidentiality notice up the left rail that legal asked for. And it has to be editable at the last minute, because someone always wants one more sentence on slide 5 twenty minutes before the meeting.
Every one of those requirements argues against generating a picture of a deck and for generating the deck. A rendered PDF fails the last-minute edit. An HTML report fails the "email it to the audit committee" test. A summary in a chat window fails all three.
So the target is narrow and unambiguous: an ordinary PowerPoint file, built from your own template, that nobody has to retype.
What actually came out
One run, on 2026-08-21, against the six-slide finance template that ships with the workspace. The output of the build step, as it printed:
Built `project://files/close_review.file.pptx` from the shipped template:
61 token occurrences filled across 6 slides, plus a generated 68KB chart
in slide 4's `chart_image_slot`.

| Check                       | Result |
| Distinct tokens before      | 58 |
| Occurrences replaced        | 61 |
| Tokens left after reopening | 0  |
| Pictures on slide 4         | 1  |
Two bits of house vocabulary in there. project://files/… is how the workspace addresses a document it owns, the way a path addresses a file on your laptop, and .file.pptx is its type followed by its extension rather than a typo. And what the build calls a token is what this post calls a placeholder — same thing, counted two ways below.
The deck came out at 442,219 bytes. A second, independent run of the same step later that day — a different destination file, so the two could not be confused with one another — landed on exactly the same byte count and was stored as version 1 with the correct PowerPoint MIME type. Byte-identical output from two separate runs is worth more than the number itself: it says the build is deterministic, which is the property you want in something that produces board material.
Three things in that output are load-bearing.
58 distinct placeholders, 61 occurrences. Those are different numbers because one placeholder can appear in several boxes — the brand name alone fills four. The pre-flight counts names; the fill counts places.
Zero placeholders left after reopening. This is the check that matters, and it is deliberately done by closing the saved file and opening it again from disk. A deck that still carries one {{ client_name }} looks finished right up until somebody reads it out loud in a room. The fill is strict — a missing value fails the run rather than silently leaving the placeholder in — and then the reopen proves the strictness worked on the bytes that were actually written.
One picture on slide 4. The generated chart landed in the slot.
Where the deck shows up
You ask for it in chat, in a sentence, naming the file you want. You do not assemble the deck yourself.
While the agent works, the run behaves like any other: it starts, it finishes, and the composer comes back. When it is done, the deck is a document in your project — it appears among the project's files, alongside everything else the workspace holds for you, and you open it from there. It is not an attachment in a conversation that scrolls away, and it does not live inside the run that made it.
That last part is a real design decision rather than a detail. A file that only exists inside a chat thread is a file somebody has to find again in three weeks when the auditor asks which version went to the board. A file that is a document in the project has a version, a timestamp and a place to be found.
Your template is the design. The agent only fills it in.
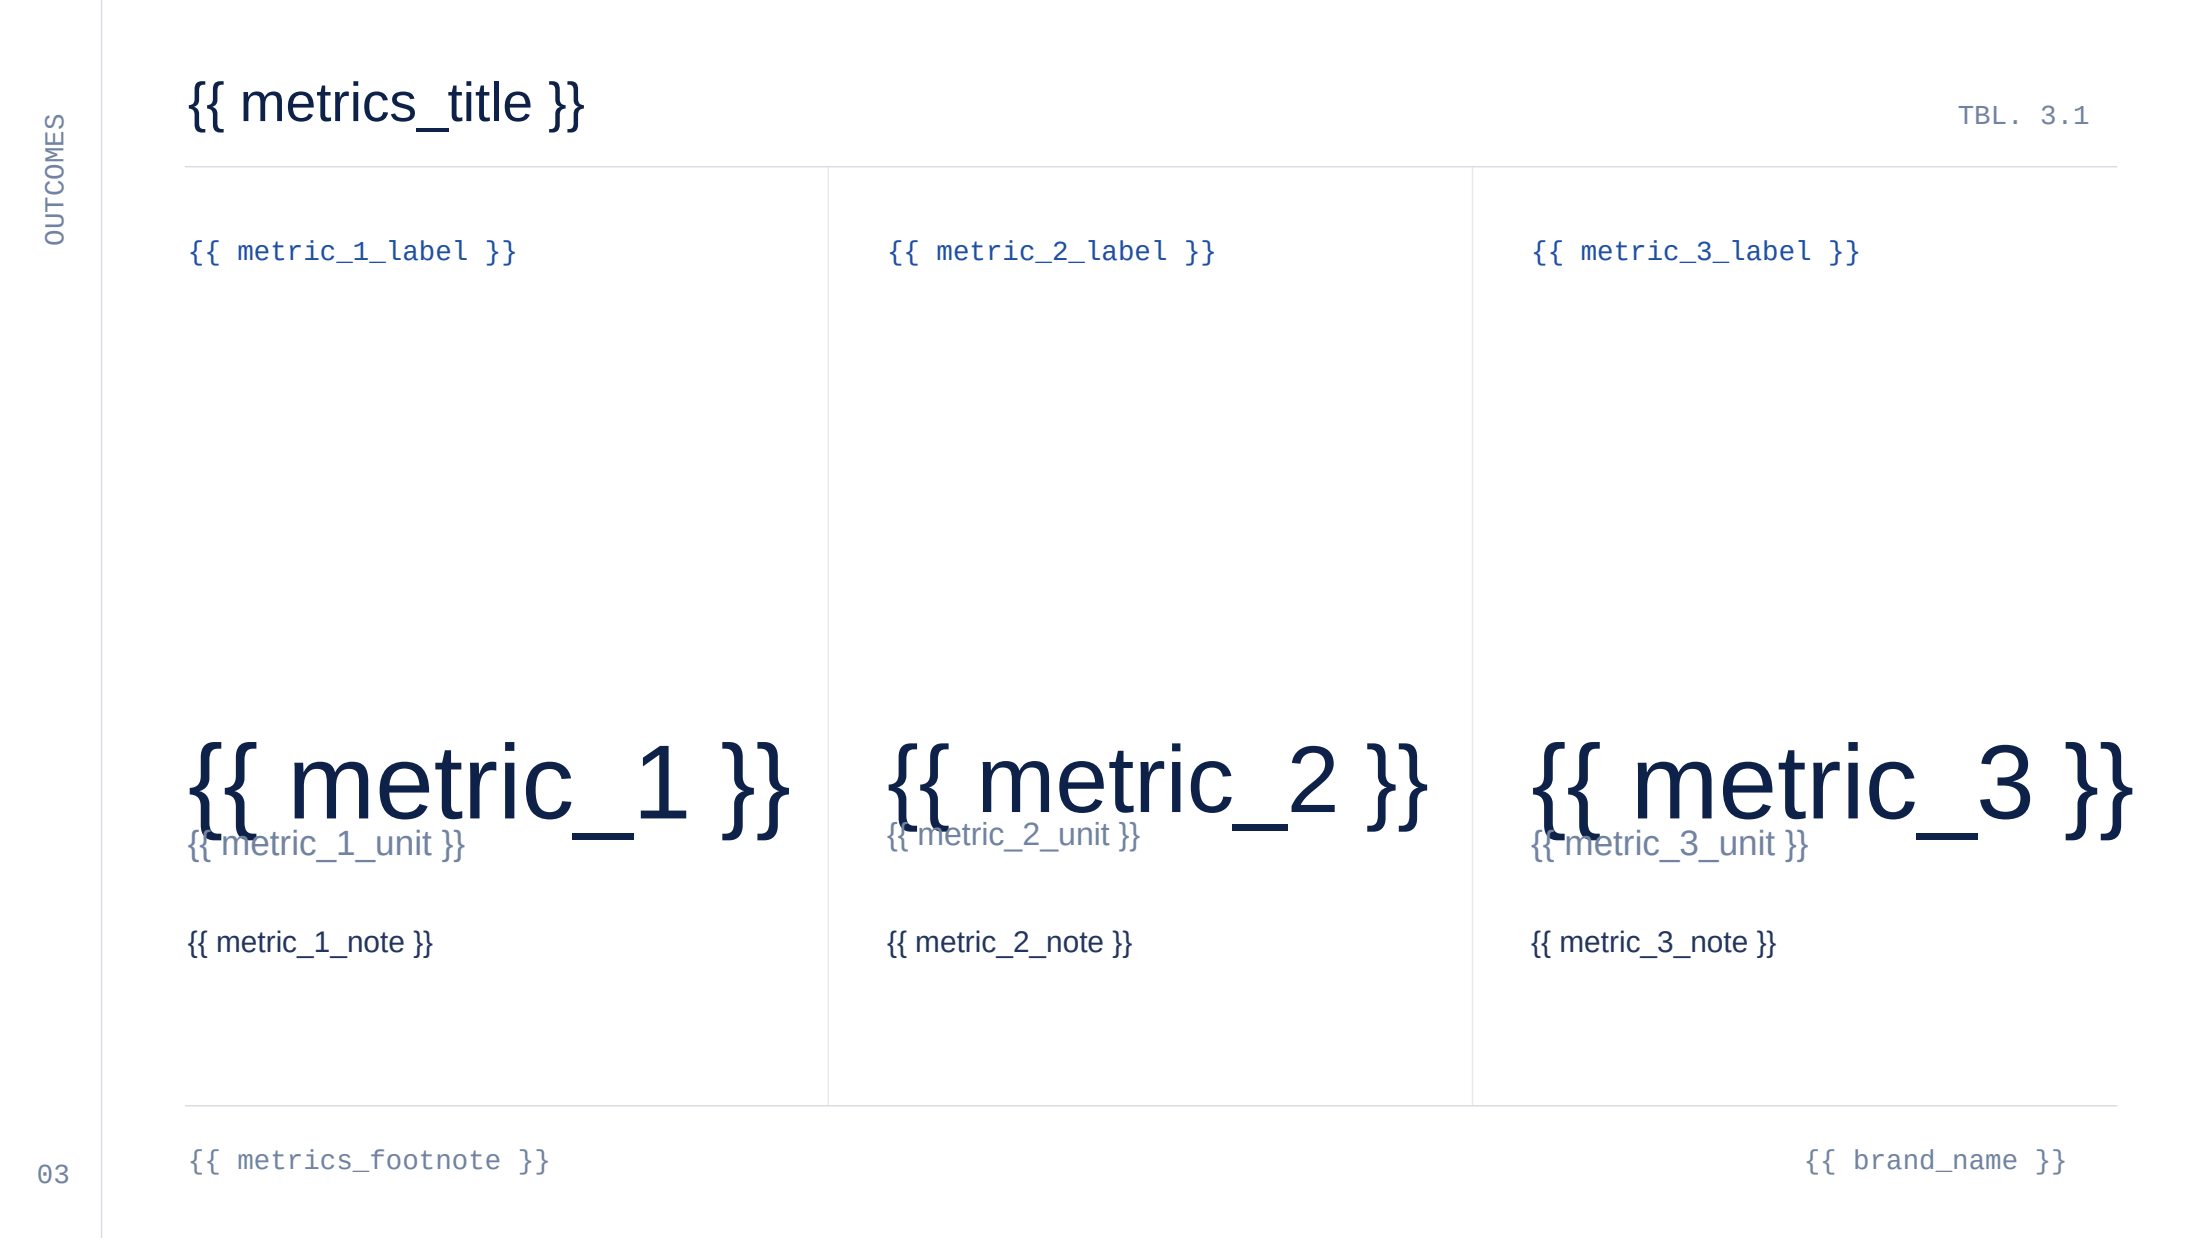
Here is slide 3 of the template, as shipped, rendered straight from the file:
And here is the same slide in the produced deck:
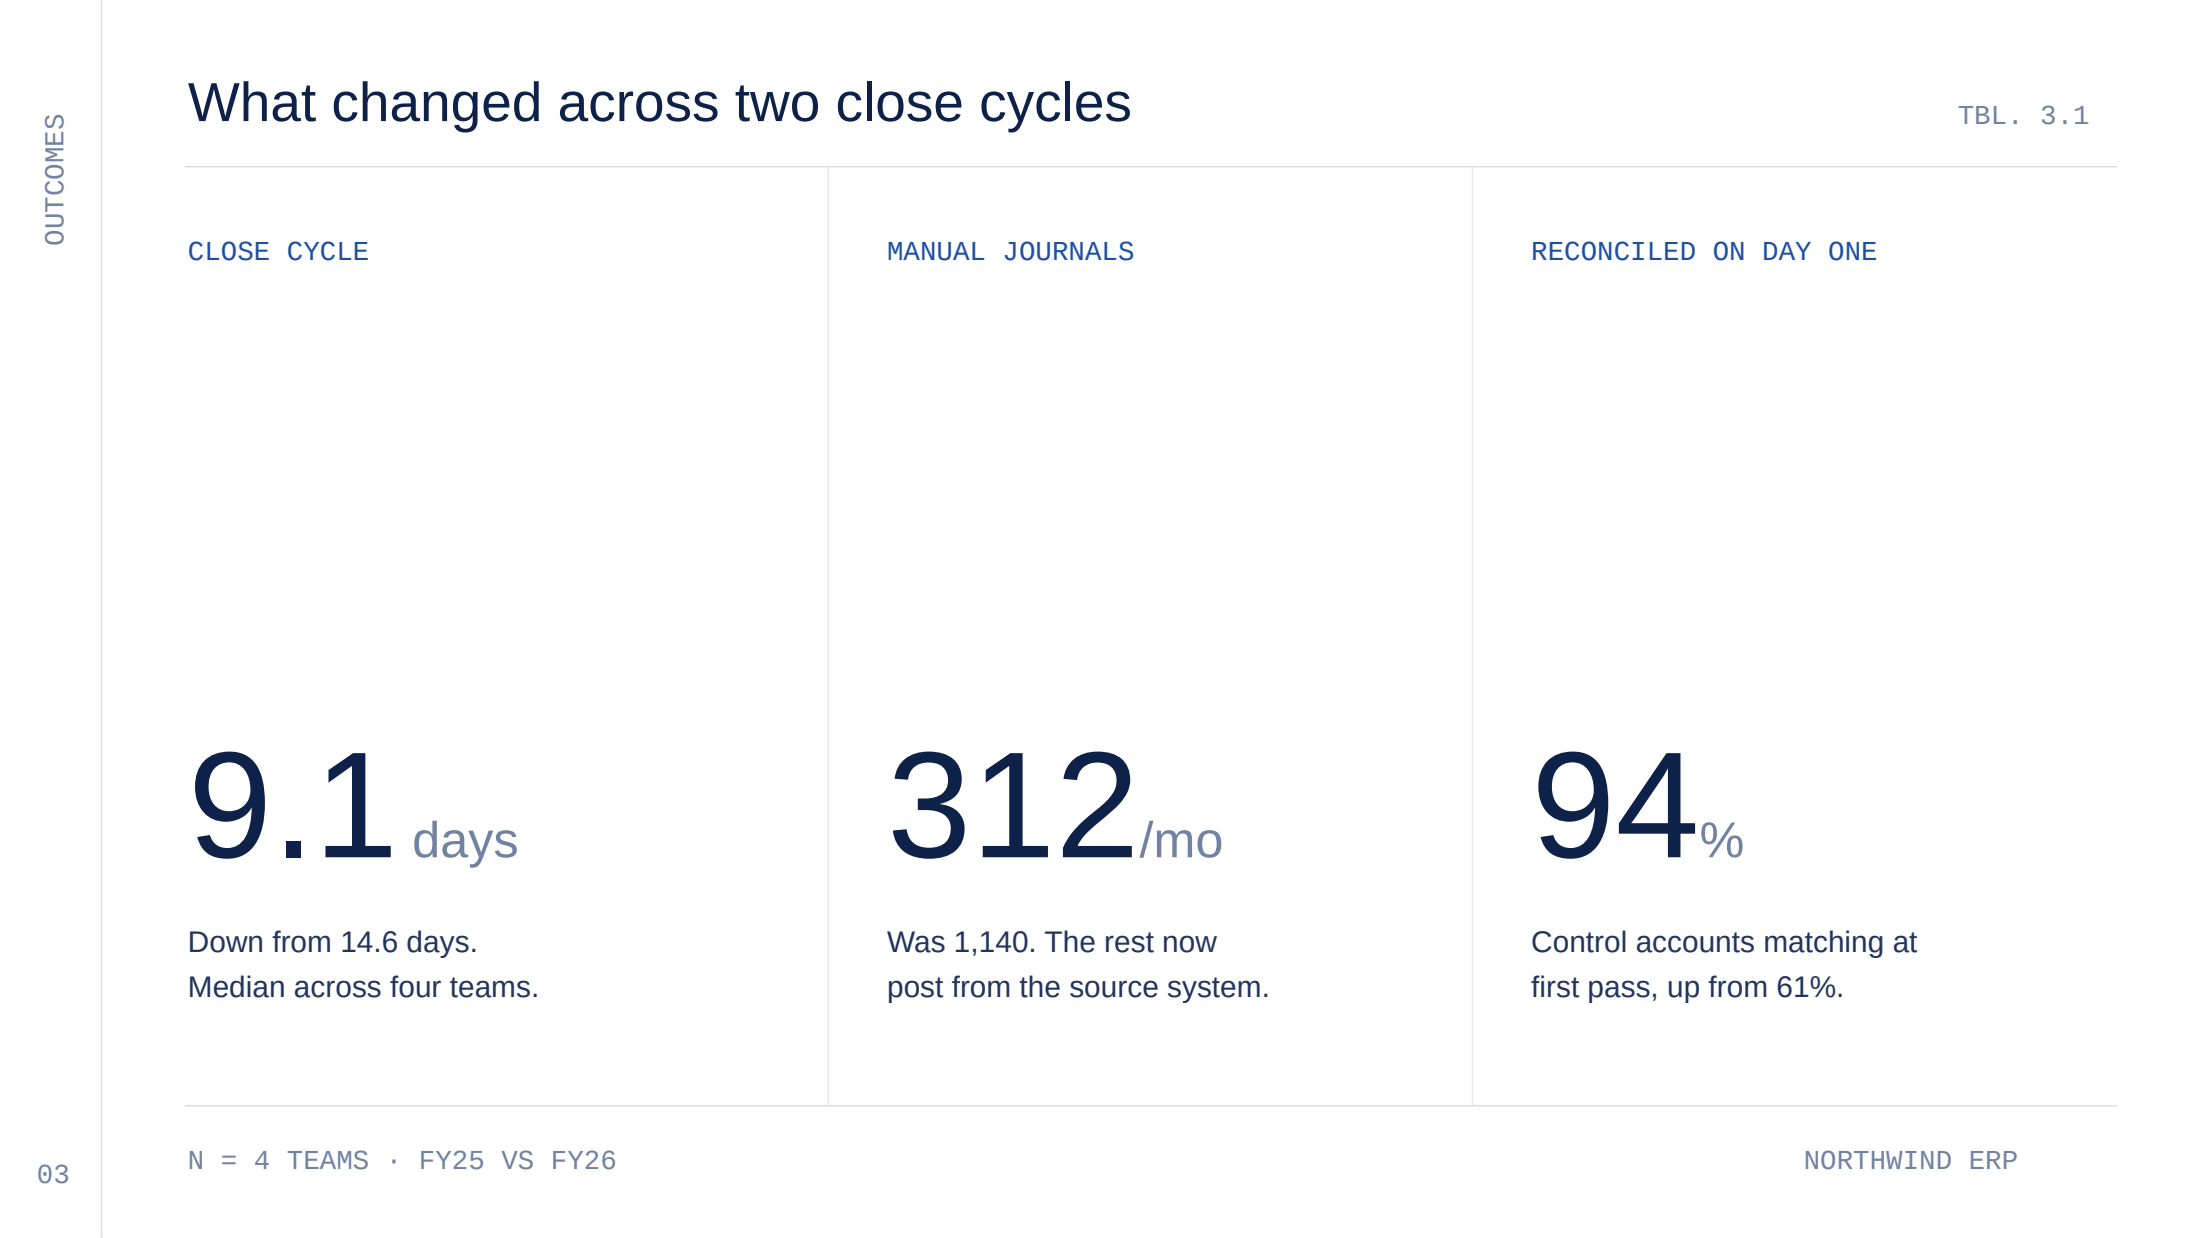
Nothing about the design was decided by a model. The columns, the hairlines between them, the 99pt figure size, the blue Courier column labels — that is the template, which is an ordinary PowerPoint file a designer made and can keep editing. The agent's entire contribution to that slide is fifteen strings.
The part that is harder than it looks is in the detail: 9.1 renders at 99pt navy, and days renders at 33pt grey beside it. Those are two differently styled pieces of one line, each keeping its own size and colour.
PowerPoint stores a line of text as a series of separately styled fragments, split at arbitrary boundaries — so a word you are searching for may be stored as two pieces and a plain find-and-replace never matches it. The obvious workaround, replacing the whole line's text at once, flattens every fragment into a single style and takes bold, colour, size and hyperlinks with it. That one mistake is the most common way to wreck a deck programmatically. So the fill matches on the whole line and then writes back into the specific fragment each match sits in, descending into grouped shapes, table cells and speaker notes on the way. A deck whose notes still read {{ client_name }} has shipped unfinished too.
There is one more consequence of PowerPoint having no layout engine: text that is too long overflows its box visibly rather than shrinking. So each slot needs a budget somebody measured. That is a genuine cost of tokenizing a template, and it is paid once per template rather than once per deck.
The chart is generated, and it is matplotlib
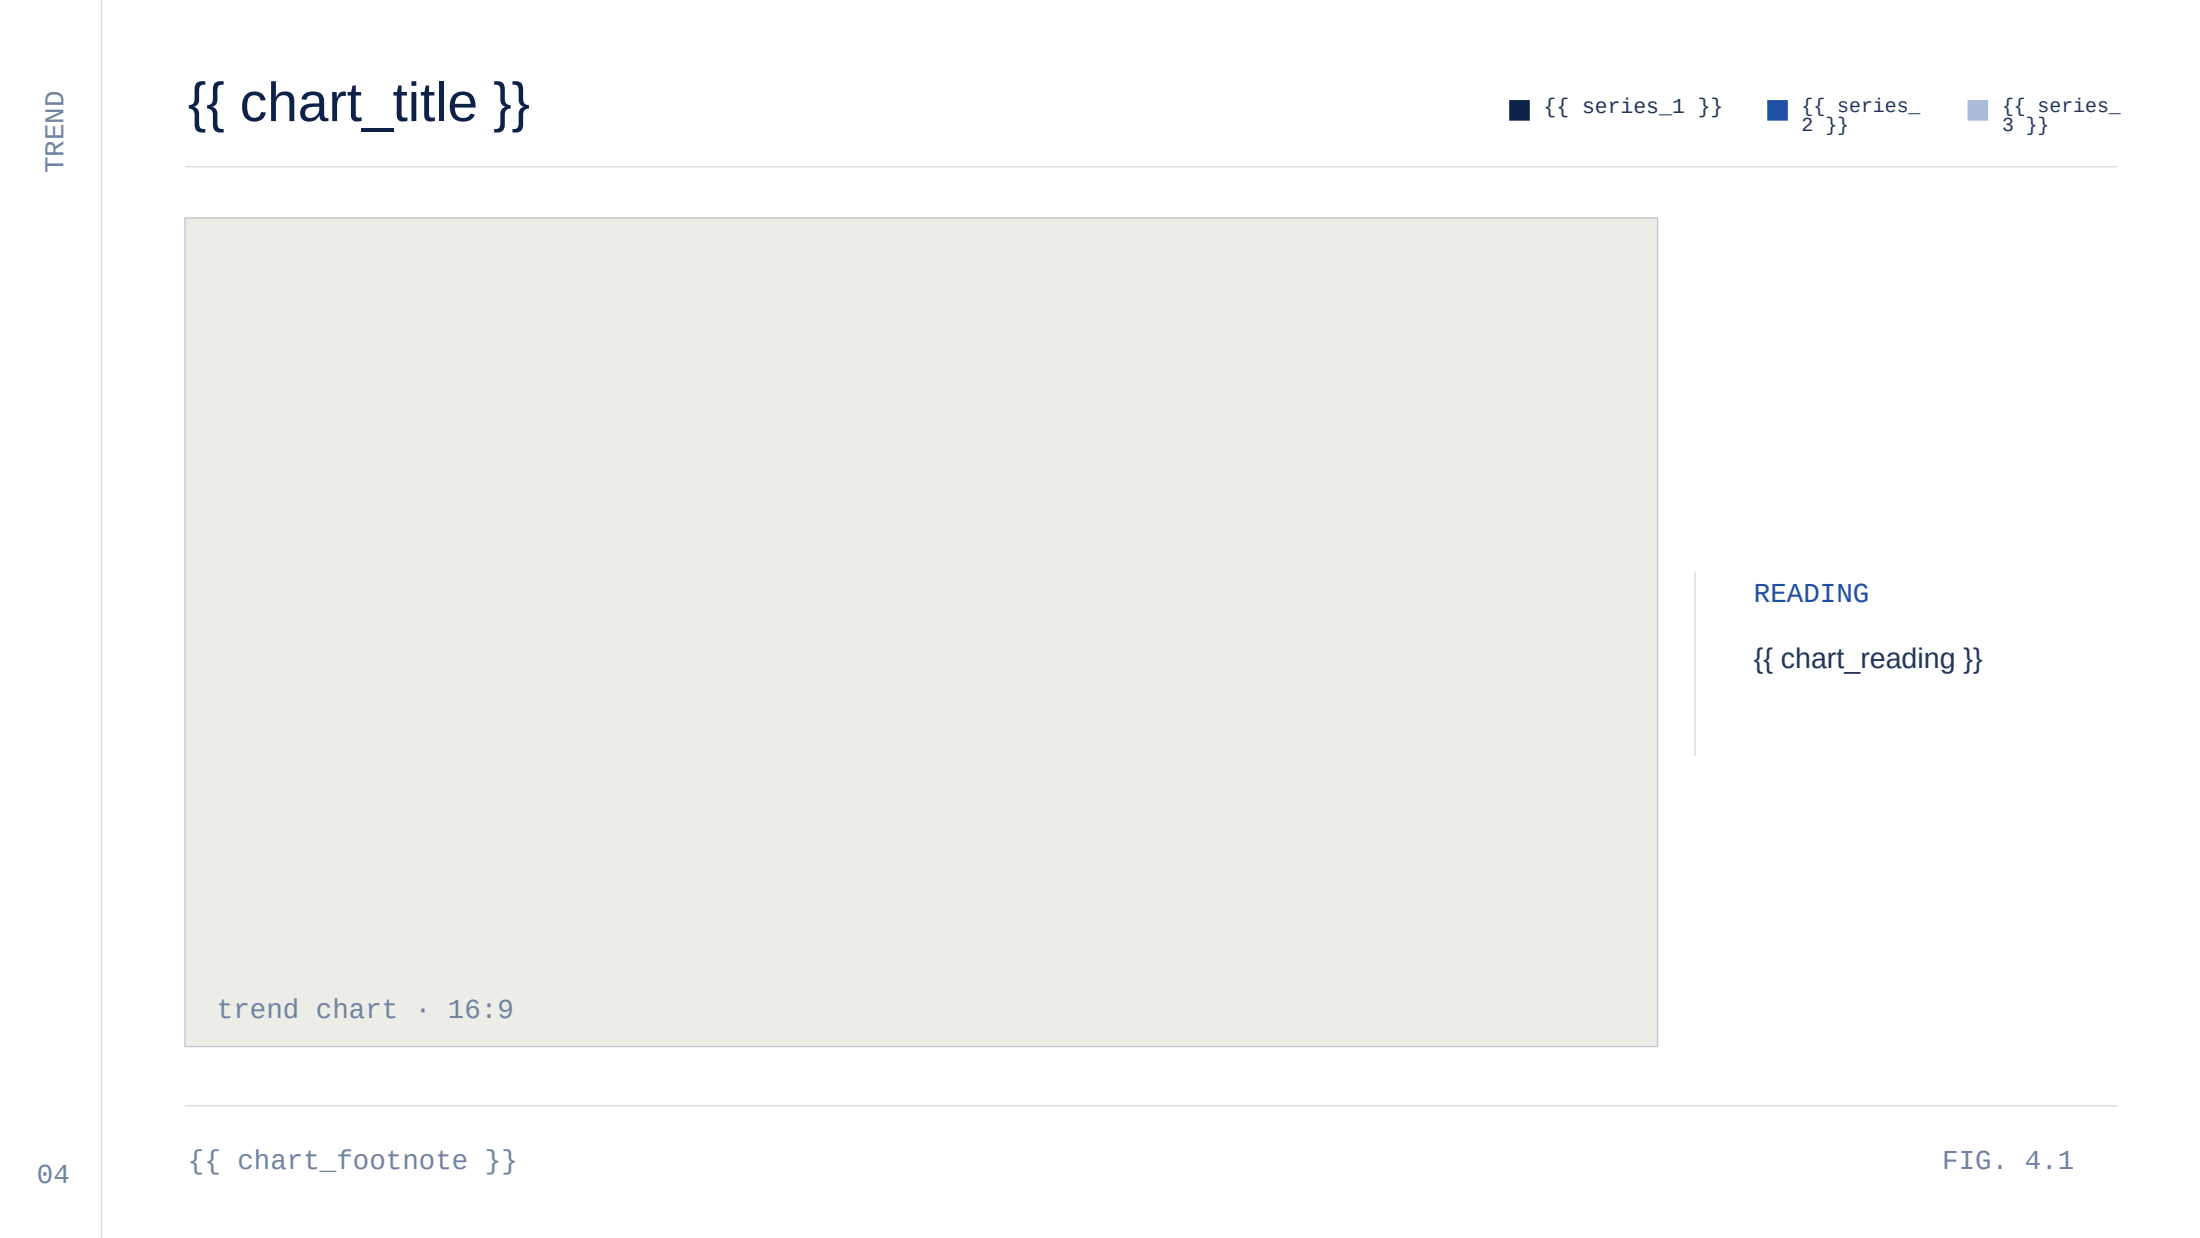
The template reserves a slot for the trend chart. Here it is empty, captioned trend chart · 16:9:
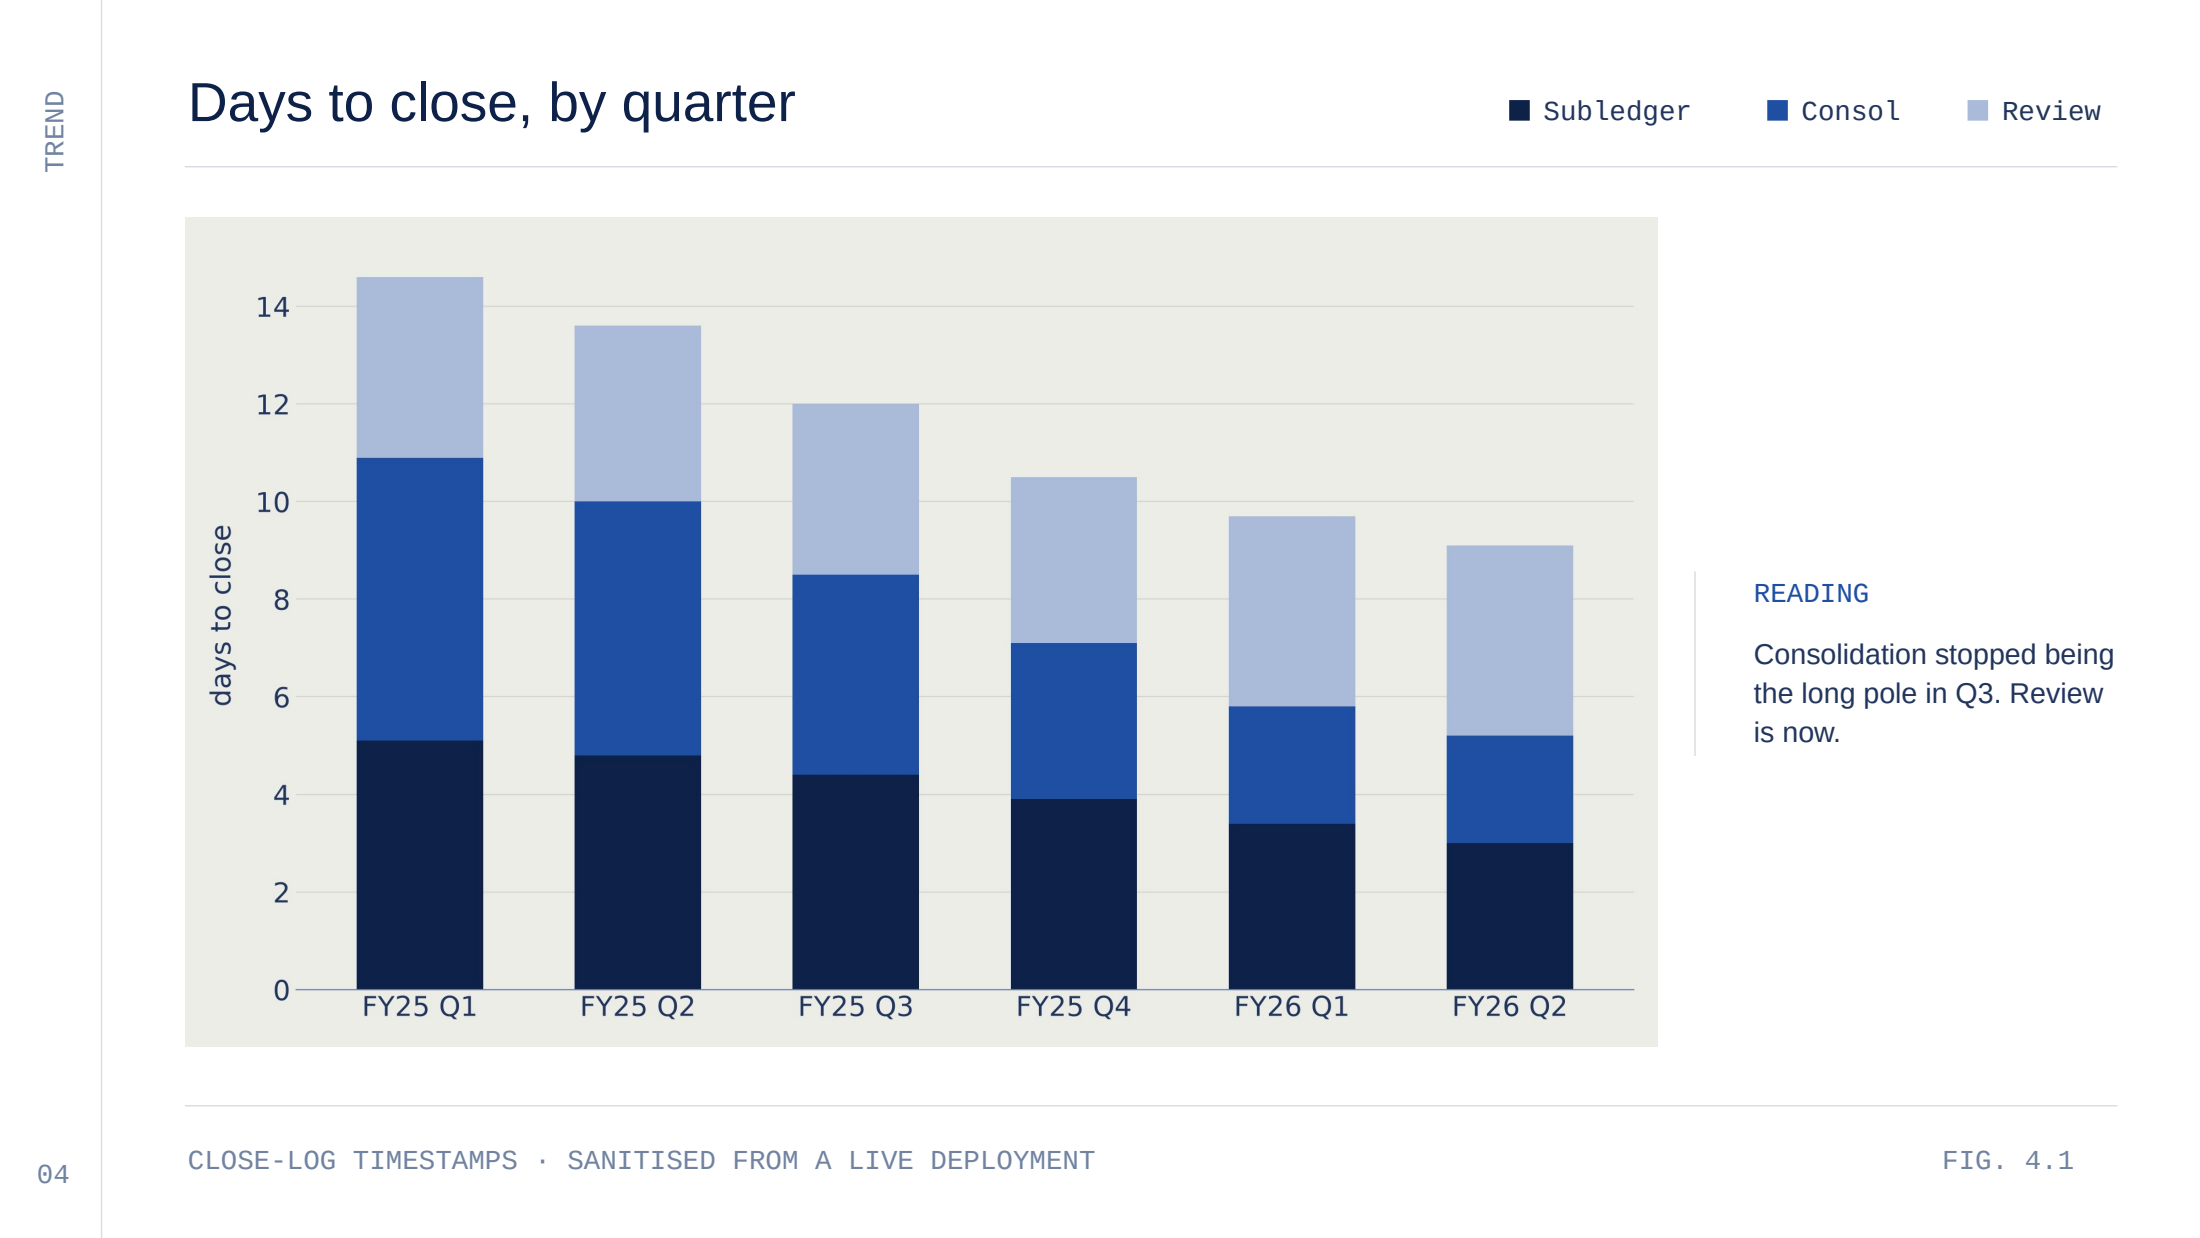
And here it is in the produced deck, with the chart the run generated:
The chart library is matplotlib, and it is matplotlib because Plotly cannot work here.
Chart code runs inside a sandbox, and that sandbox's memory ceiling is an isolation boundary rather than a setting anyone can raise. Plotly's only static image exporter is kaleido, kaleido drives a headless Chromium, and Chromium cannot reserve its V8 heap inside any ceiling the sandbox permits. This was measured at both ends of the range: the 4 GiB cap on a single step, and the 6 GiB absolute maximum that step could ever raise itself to. There is no permitted configuration in which it works.
Worse, it does not fail. fig.to_image(...) does not raise an error — it hangs until the 180-second wall timeout and returns nothing, which is the most expensive possible way to discover the problem. kaleido installs cleanly and imports fine; that proves nothing at all.
matplotlib renders in-process instead, and the fix for "matplotlib charts look like matplotlib" turns out to be geometry rather than styling. The figure is sized in inches taken off the slot shape itself, so an axis label set at 18pt arrives on the slide as real 18pt type beside the deck's own 18pt labels — not as a pixel size that approximates it after scaling. The figure's paper colour is set to the mount's own fill, so there is no visible seam where the image meets the slide. The three bar colours are the template's own legend swatches, in the order the legend chips are already printed above the mount.
One more detail that only exists because someone looked at a render: the mount's trend chart · 16:9 caption is a separate shape sitting above the mount, so an image dropped at the mount's position would have printed underneath it. The caption is removed before the image goes in. It only ever labelled an empty box.
What a render caught that a green test did not
The first version of the fill reported complete success. The right count of placeholder occurrences replaced, and nothing raised. Every automated check was green.
The rendered slides showed three defects:
- The metric units were repainted at the figure's size and colour —
days,/moand%all rendered at 99pt navy instead of 33pt grey, because the replacement was writing to the whole line rather than to the fragment the match sat in. Invisible from the log. Obvious in one look. That is what produced the fragment-level rewrite described above. 9.1days, with no space. The figure and the unit abut with no separator, so the space has to belong to the unit —" days", not"days".- Body copy on slide 5 ran to the right edge of its box, even though it sat inside the character budget the slot declared. The copy was shortened. The general lesson is the one in step 3 below: a character count is a proxy for width and a loose one, and the only way to know a value fits is to put it in and look.
None of the three is detectable from a passing test, and all three are visible in one glance at a render. Which is the argument for making per-slide rendering part of the loop rather than a debugging step: a generator that wrote a beautiful deck and one that wrote a broken deck look identical from the inside.
The renders above came from converting the deck to PDF headlessly and then rasterizing each page, which produced 2200 × 1238 images. They are exactly those files — not mockups, and not redrawings.
Build your first deck
- Pick the deck you rebuild every month. Not your most beautiful one — your most repetitive one. The board pack, the lender update, the monthly ops review. The value is in the repetition, so the right first candidate is whatever you have already rebuilt four times.
- Tokenize it once. Open the file, and everywhere a value belongs, put a named placeholder:
{{ metric_1 }},{{ deck_date }},{{ chart_reading }}. Name them for what they mean, not for where they sit — the box may move. Leave everything that is genuinely boilerplate as literal text. - Budget each slot by looking, not by counting. Type the longest value you would realistically ever put in each box and check it does not overflow. There is no auto-fit to save you, and a two-line body is a tighter budget than it looks.
- Fill it strictly, then reopen it. Every placeholder gets a value or the run fails — silence is not success here. Then close the file, open it again from disk, and confirm nothing survived. That reopen is the only check that speaks about the bytes you will actually send.
- Look at the slides. Render them and look. This is not a formality; it is the step that caught all three defects above while every automated check was green.
Where the numbers come from — the honest version
The deck above is a demo deck. Its content is fixture data: a fictional "Northwind ERP", four finance teams, a sanitised close log. In this run, the values were written into the build step directly rather than read from any ledger.
Two things were tested, separately. One: a request typed in chat ends with exactly one finished .pptx saved as a project document, with real bytes on disk. That proves the plumbing. Two: the build step fills all 61 placeholder occurrences and generates the chart in place — that is the dated run above, which was started from the build step rather than from a typed request. What has not happened in a single run is both at once. Nothing here was asked for in chat and then checked for leftover placeholders, and the evidence should be read at exactly that weight.
That split is deliberate on the testing side. The end-to-end test asserts nothing about the deck's contents: not a slide count, not a value, not a colour. Templates and copy get re-cut far more often than the plumbing under them, and a test coupled to the output would turn every legitimate improvement into a red build. So the rails have their own test, and the deck's content is proven by dated runs. Those are two different kinds of evidence, and it is worth knowing which one you are being shown.
What would the real thing look like? This template is an ERP finance template — a month-end close deck, with a source-to-reporting layer diagram, a days-to-close trend and a control-account reconciliation rate. The values that belong in it are the ones your close already produces, and NetSuite already holds them: close durations off the ledger's own timestamps, manual journal counts by period, control accounts matching at first pass. Getting those out is a SuiteQL query and some arithmetic, which is its own write-up; the deck build takes the result as a plain set of named values. Which numbers deserve a written narrative rather than a chart is the next question, and a good one to settle before you tokenize anything.
Which numbers get a narrative, not a chart
A board pack is not only figures. Somebody still writes the commentary — the variance explanations, the executive summary, the paragraph that tells executives what happened and what to do about it — and translating the numbers into that narrative remains stubbornly manual.
Controllers spend hours writing variance explanations. FP&A analysts craft the same budget commentary month after month with only minor updates. CFOs receive data-dense board packages that require significant mental effort to interpret. This manual approach creates three persistent problems:
- Inconsistency. Different analysts explain the same variance differently. Board packages vary in quality depending on who prepared them. There's no institutional memory of what was communicated before.
- Time pressure. Commentary is typically the last step before a deadline, written when teams are most exhausted. Quality suffers when every minute counts.
- Strategic displacement. Every hour spent writing routine commentary is an hour not spent on strategic analysis.
Not all financial narratives are equal. Some require deep strategic judgment that humans do best. Others follow predictable patterns that AI can draft well:
| Narrative Type | Use Case | Frequency | AI Fit |
|---|---|---|---|
| Financial Statement Commentary | Income statement, balance sheet, cash flow | Monthly | High |
| Variance Explanations | Budget vs actual, period-over-period | Monthly | Very High |
| Executive Summaries | Board packages, C-suite briefings | Monthly/Quarterly | High |
| Cash Position Updates | Treasury reports, liquidity analysis | Weekly | Very High |
| AR/AP Aging Commentary | Collections risk, payment optimization | Weekly | High |
Variance explanations are perhaps the highest-value application. The variance is decomposed into volume, rate and mix components, classified as controllable or uncontrollable, and filtered through materiality thresholds (typically flagging items >25% or >$100K as critical). The result is consistent variance commentary rather than whatever the analyst on duty happened to write.
Executive summaries synthesize complex performance into digestible insight, with tone and detail adapted to the audience: more detail for the CFO, more strategic context for the board.
Cash position updates turn current balances, runway projections, collection probabilities by aging bucket and liquidity risk into a treasury narrative.
Structure the commentary before you generate it
Generated commentary is only as good as the framework that guides it. The Pyramid Principle organizes communication top-down: lead with the conclusion, then support it with grouped arguments, then provide supporting data. Instead of:
"Revenue was $12.4M in Q1, compared to $11.8M in Q4 and $10.2M in Q1 last year, representing a 5% sequential increase and 22% year-over-year growth..."
Pyramid Principle output reads:
"Revenue exceeded plan by $800K (7%) driven by accelerated enterprise deals. Sequential growth of 5% reflects normal seasonality, while the 22% YoY improvement validates our market expansion strategy."
SCQA (Situation-Complication-Question-Answer) structures a narrative for a decision:
- Situation: Q1 revenue came in at $12.4M
- Complication: This was $800K above plan, but driven by pull-forward from Q2
- Question: How should we adjust Q2 forecast?
- Answer: Reduce Q2 target by $500K to account for timing; net H1 remains on plan
Audience adaptation matters as much. A CFO needs detailed variance decomposition. A CEO needs strategic implications. A board needs context about market position and competitive dynamics.
Govern the words the way you govern the deck
Generated narrative needs the same discipline as the fill: every narrative linked to the source data it was written from, human review before anything is distributed, and version control. The team's job shifts from writing commentary to reviewing and refining drafts — the model writes the first draft, people supply the judgment. Start with high-volume, low-risk narratives: variance commentary and cash position updates on internal reports, before anything reaches a board package or an external disclosure.
The honest limits
- The charts are images, not native PowerPoint chart objects. Nobody can click into a chart in the delivered deck and edit the underlying series; you change the inputs and regenerate. For a board pack this is usually correct — the numbers should come from the ledger, not from someone nudging a data table inside a slide — but if your reviewers expect to edit chart data in the file, this is the wrong tool.
- It fills a template; it does not design a deck. Slide count, order and layout are your template's. Asking for "a deck about Q3" without a template to fill is a different and much vaguer problem, and it is not the one being solved here.
- Tokenizing a template is real work, mostly spent deciding what is a value and measuring what fits. It is paid once per template rather than once per deck, but it is not zero — and we are not going to quote you a duration we have not measured.
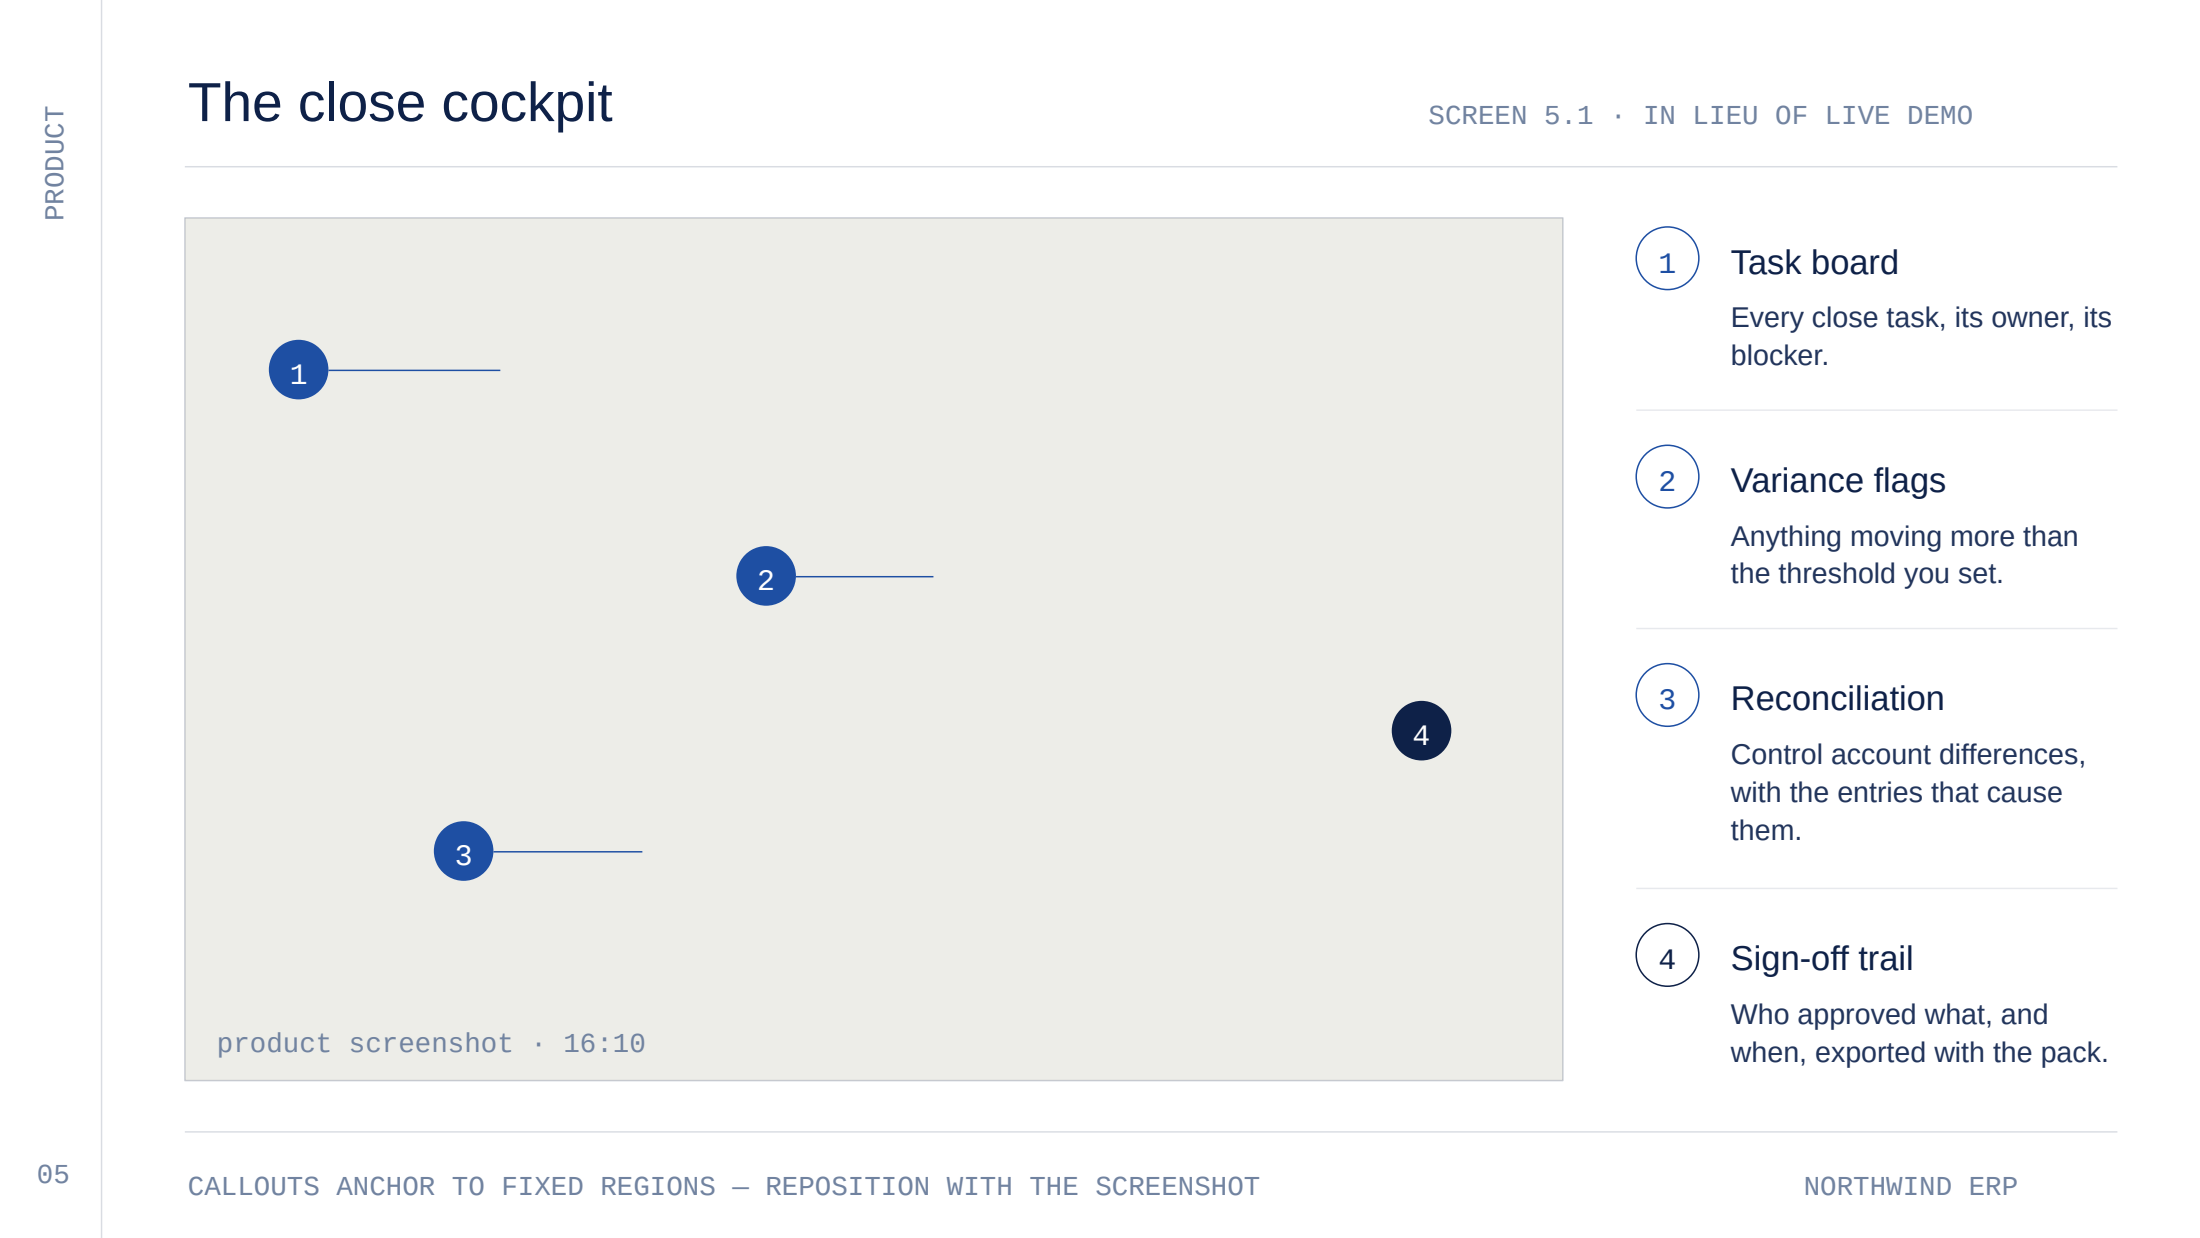
- Not every slot gets filled, and the deck says so. Slide 5's screenshot mount is deliberately left empty in the run above — that build fills one image slot, not four, and an empty mount is the honest render of that rather than a placeholder pretending to be content.
- The chart code gets 180 seconds. That ceiling is why the library choice was forced rather than merely preferred. Heavy work belongs in an earlier step that hands the deck build a finished set of values.
- No timing claim on this page. The build finished inside its 180-second budget — that much is structural, because otherwise there would be no deck. The actual wall-clock time was not recorded, so this post does not quote one. Anyone quoting you a "decks in N seconds" figure should be asked where N was measured.
The bottom line
The interesting claim here is not that an AI can write a slide. It is that the file arriving at the end is an ordinary PowerPoint document, built out of a template your team owns, with every placeholder accounted for and a check that proves it.
Everything else on this page is the cost of that being true: style-preserving replacement because PowerPoint does not store a line of text the way it reads, slot budgets because there is no layout engine, matplotlib because a headless browser cannot get a heap inside the sandbox, and per-slide rendering because three real defects were invisible to a green test.
That last one generalises well beyond decks. Automated checks tell you the machinery ran. Only looking tells you the output is fit to send — which is the same argument as trusting an agent by accumulating a record rather than by making a decision.
If you want to see this run against your template and your numbers — the placeholders visible, the fill strict, and the file at the end — request a walkthrough. Bring the deck you rebuild every month; that is the one where doing the work once pays for itself.
