Workbooks, Dashboards & Forecasting
Interactive analysis surfaces, operational dashboards, and predictive intelligence — all powered by direct SuiteQL access to your NetSuite data.
Request a DemoOperational visibility, built your way
Drag-and-drop dashboard builder with AI-powered compute cards. Embed anywhere — NetSuite subtabs, portlets, or standalone.
Drag-and-drop builder
12-column grid layout, no code required
AI compute cards
Dashboard widgets that invoke agents for live insights
Interactive controls
Date pickers, sliders, dropdowns for dynamic filtering
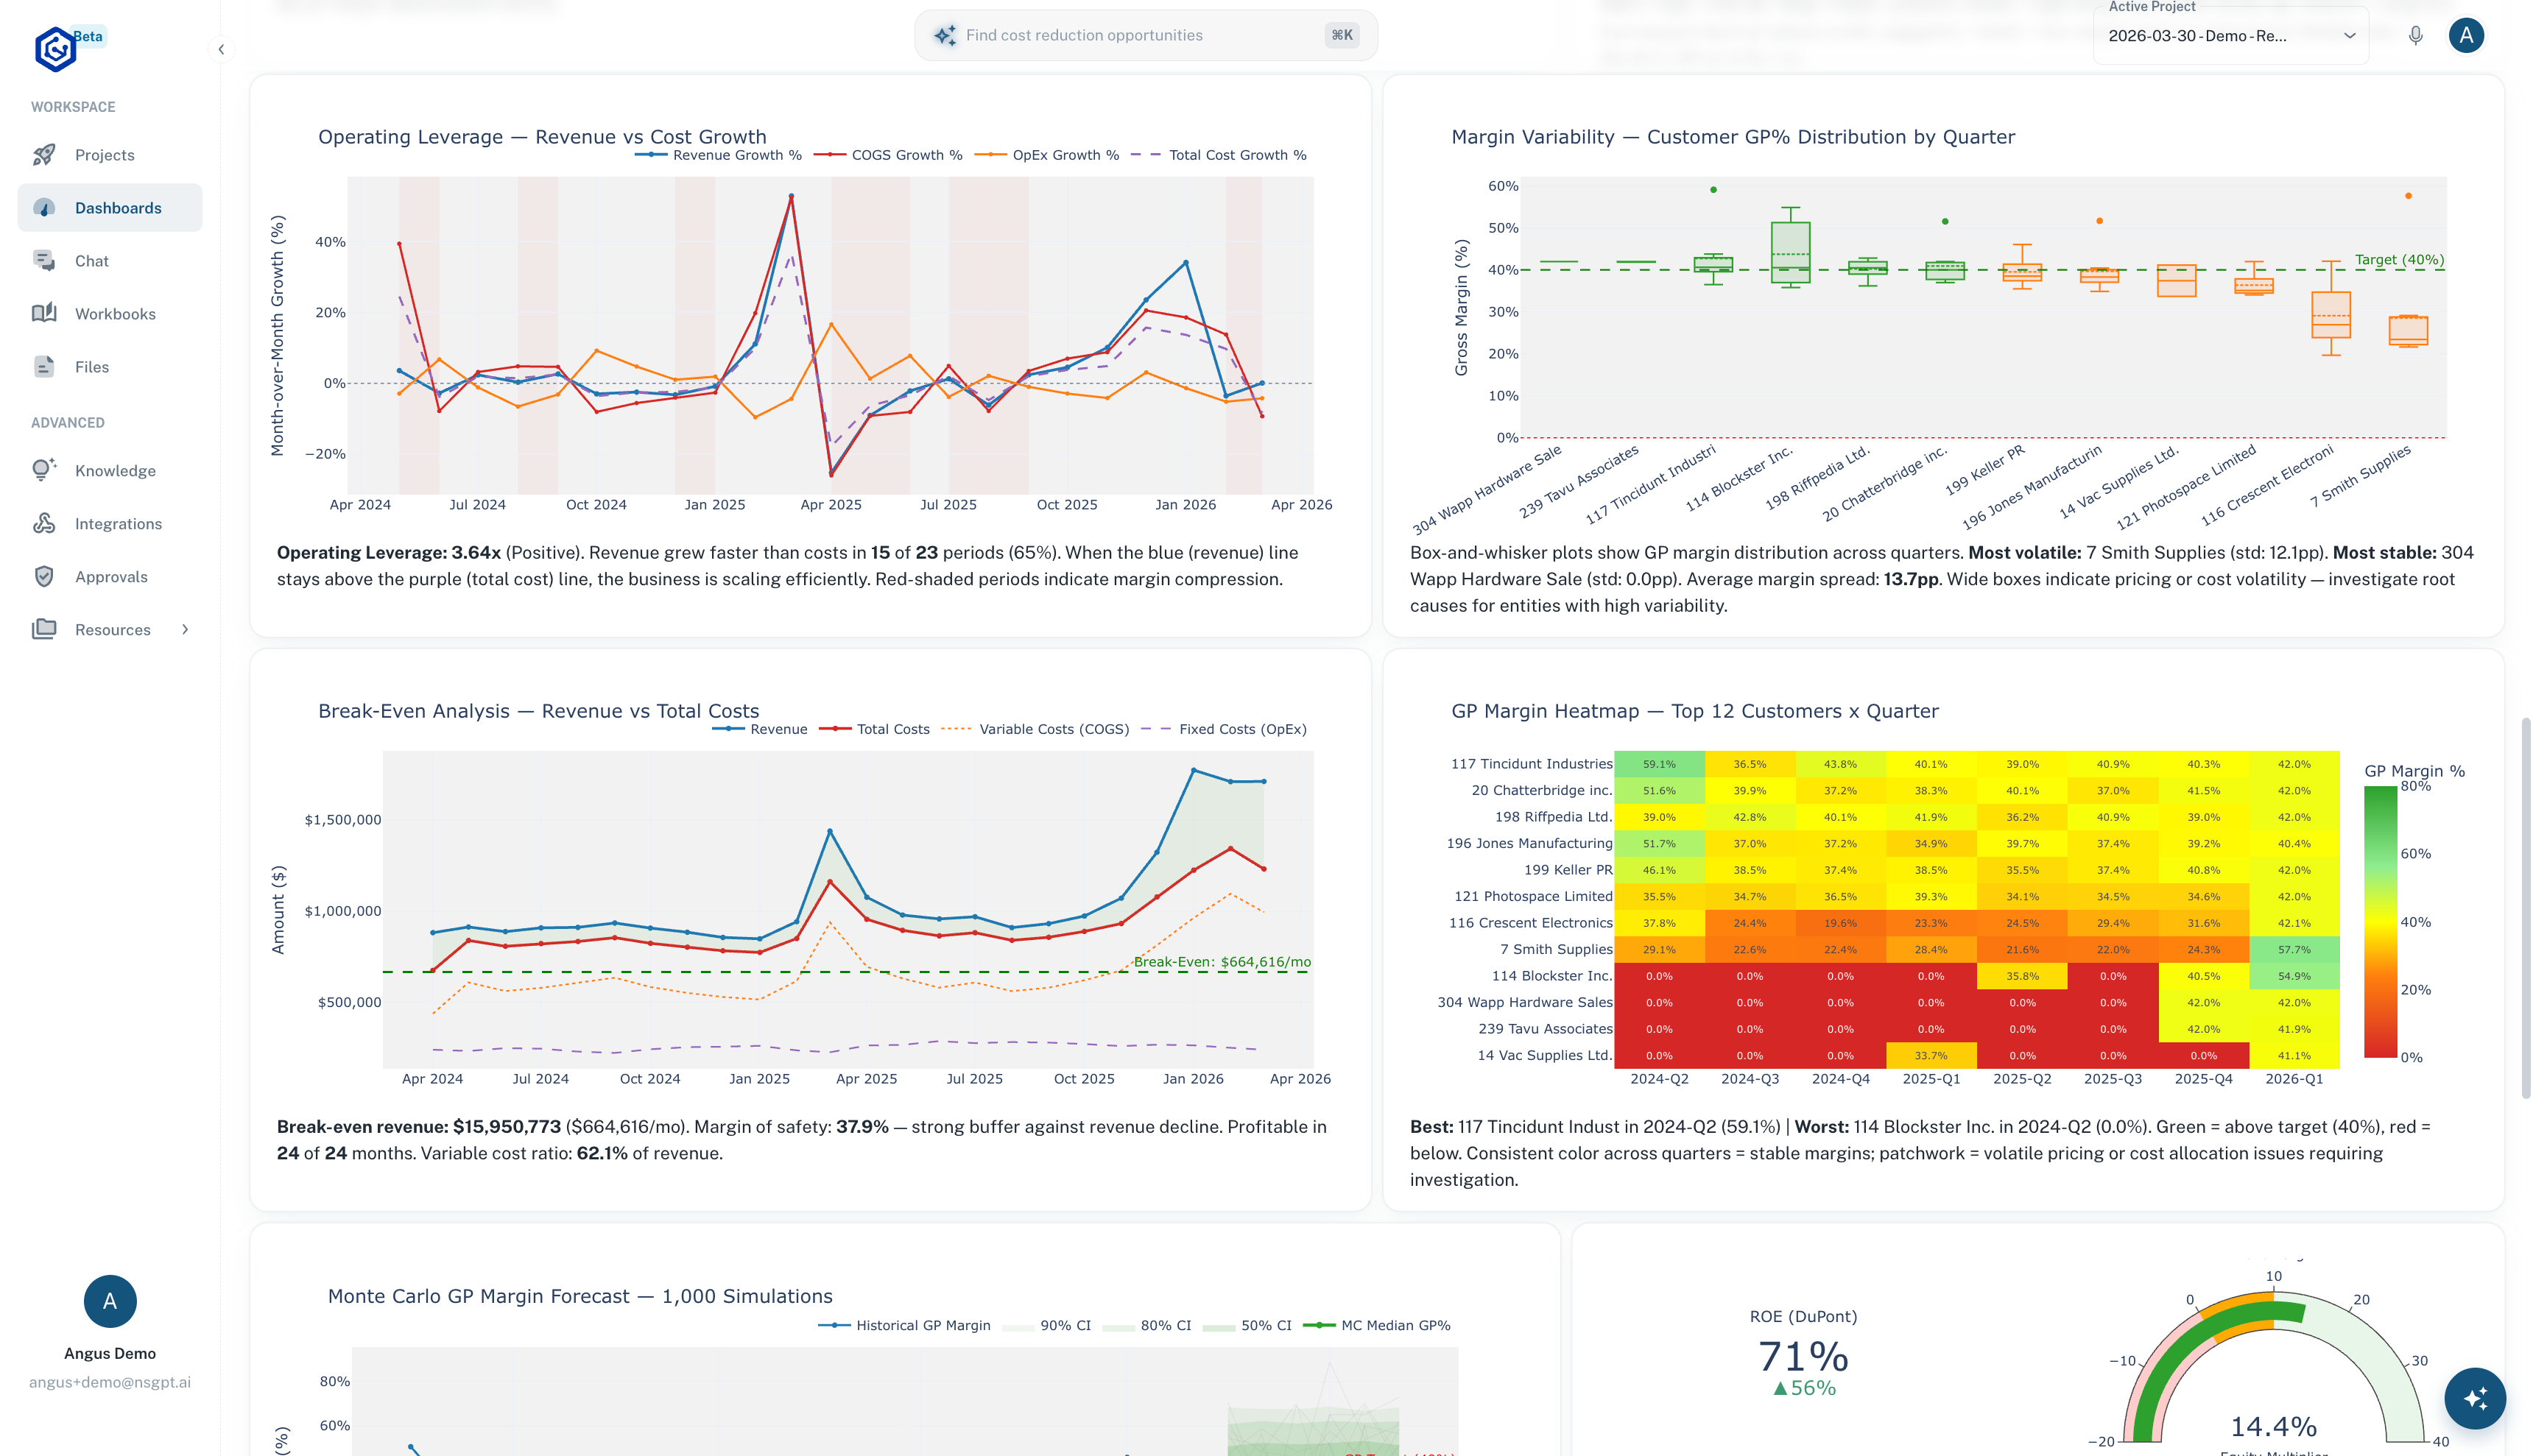
20 pre-built templates
AP Cash Management, AR Aging, Cash Flow Forecast, Customer Profitability, Executive Revenue, Inventory Health, Month-End Close, and more
Embeddable
Place dashboards directly in NetSuite record subtabs and portlets
Public sharing
Token-based access for external stakeholders
Analysis that tells a story
Rich interactive documents that combine narrative text, live code, SQL queries, and visualizations in a single shareable surface.
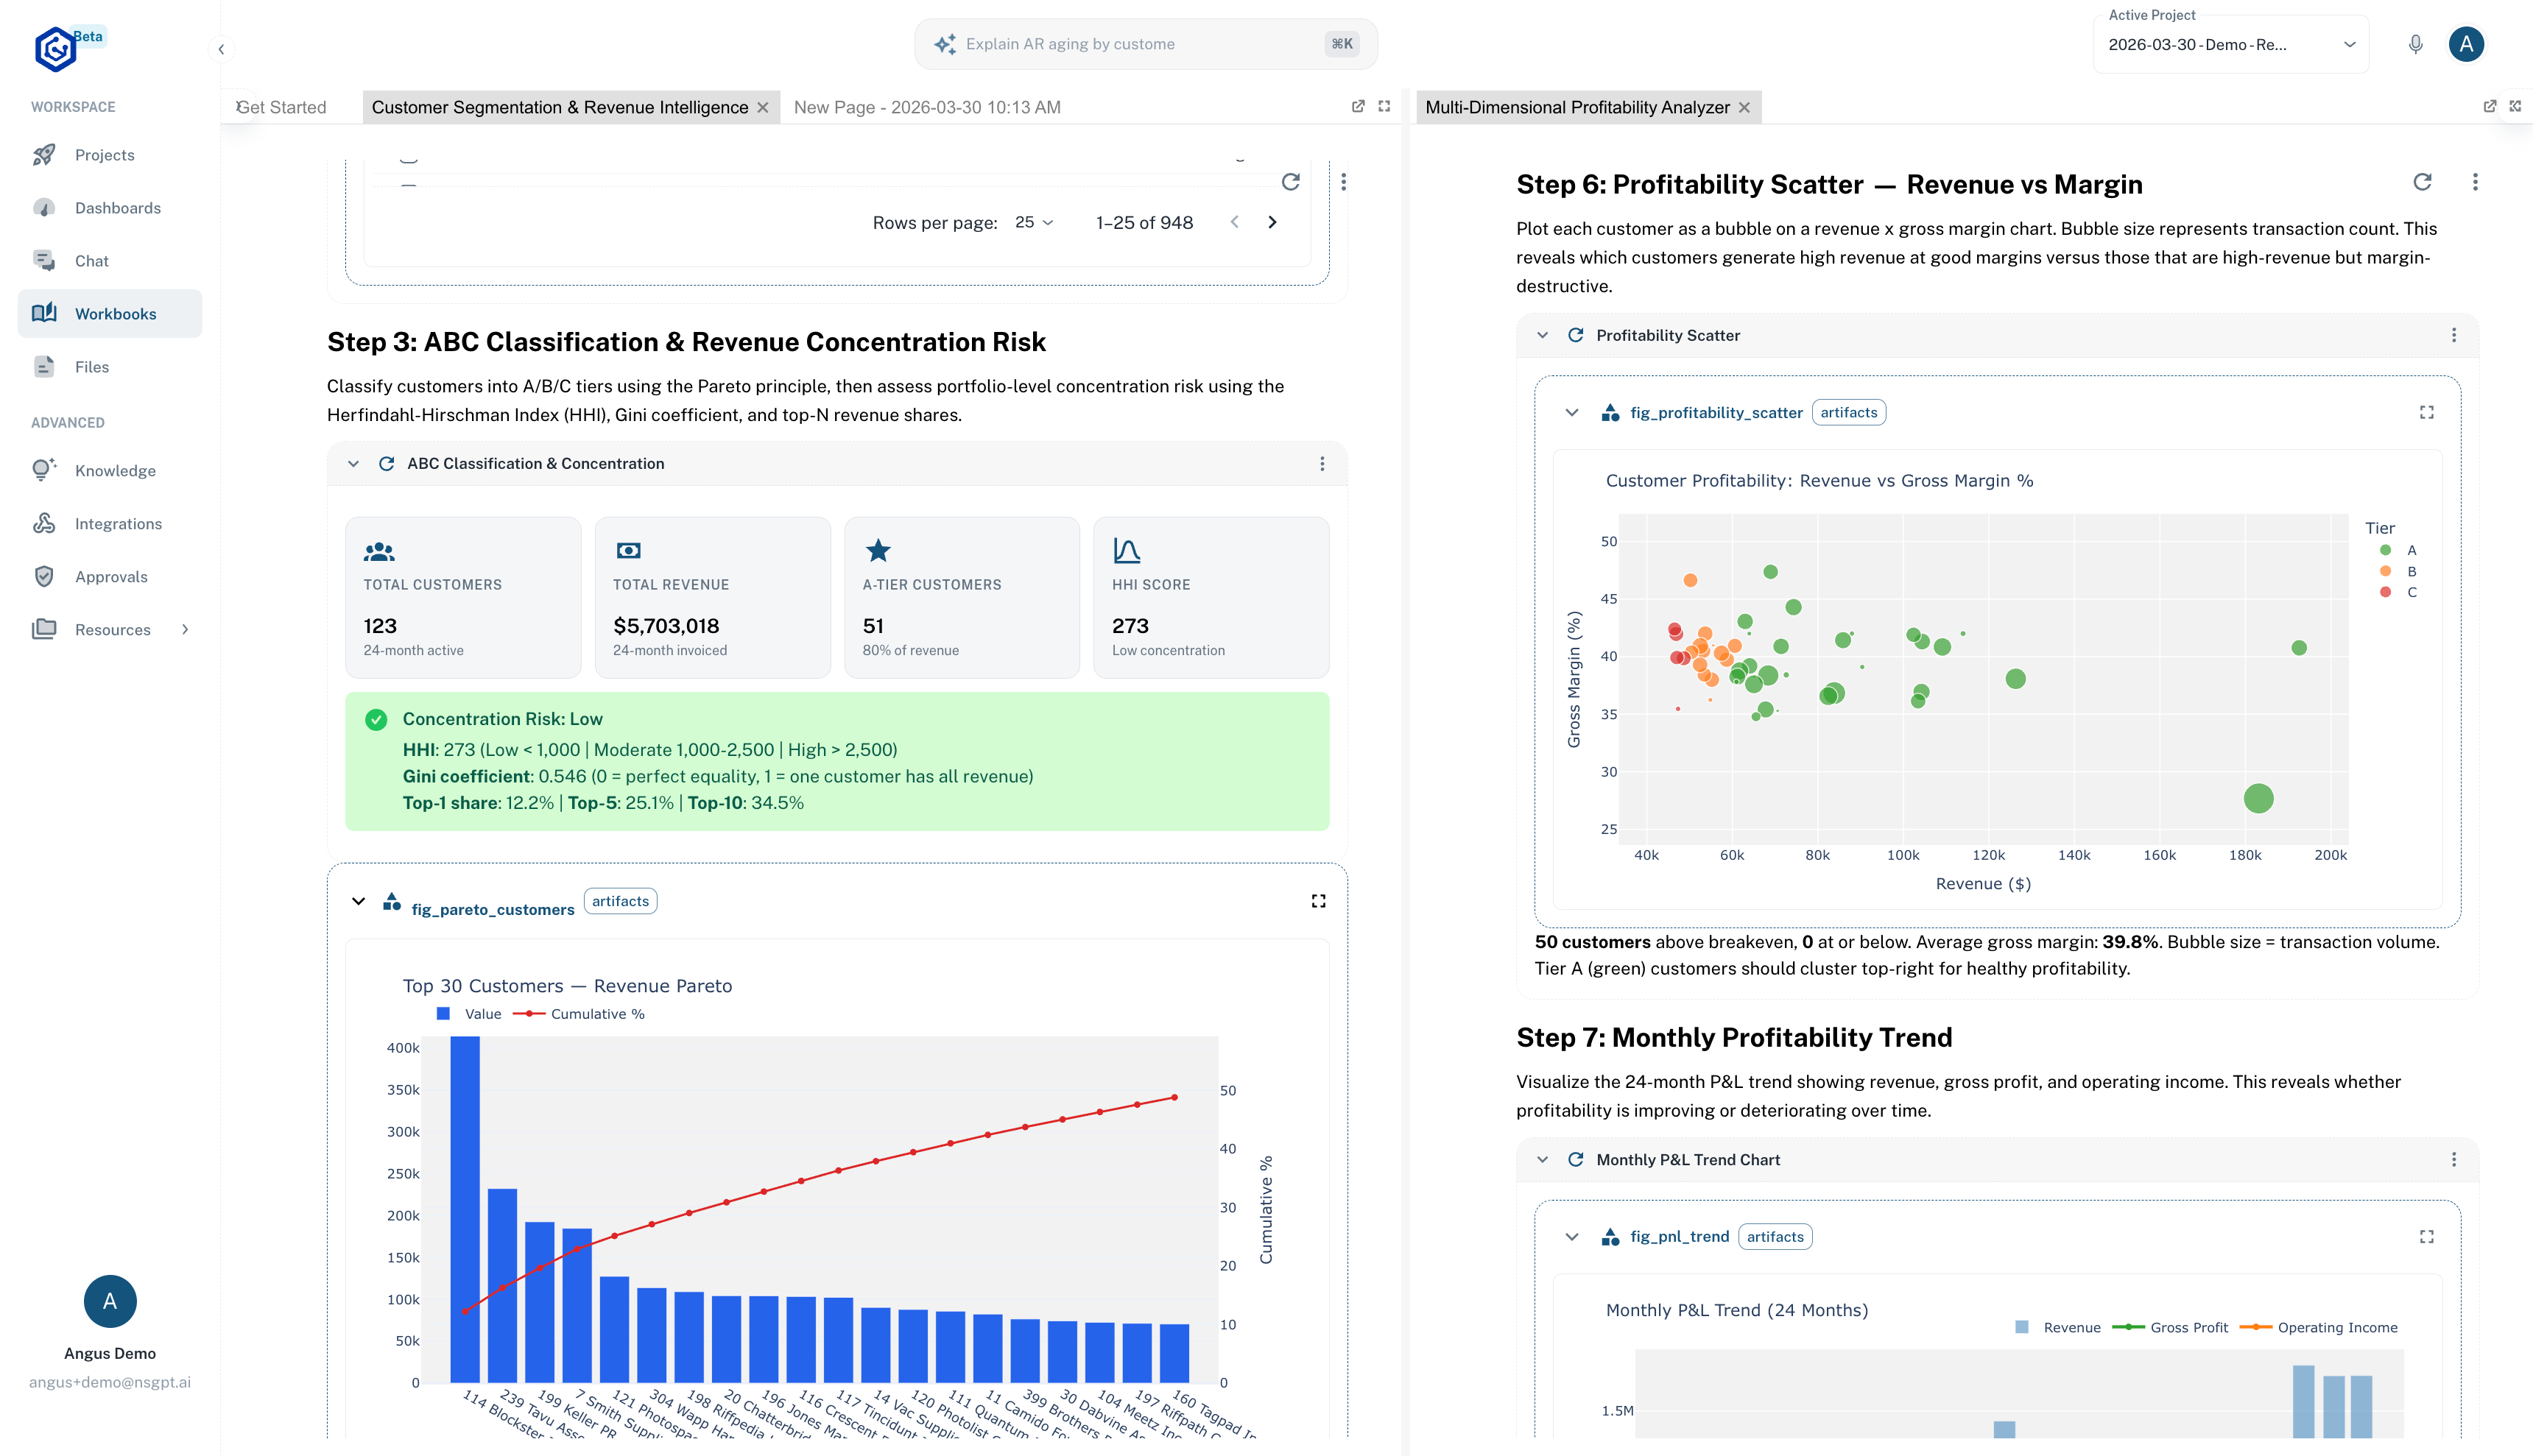
Multi-cell documents
Combine markdown, Python, SuiteQL, and chart cells
Sandboxed Python
Full pandas, numpy, scikit-learn, plotly, networkx in a secure sandbox
Inline SuiteQL
Query NetSuite data directly within workbook cells
Template library
Consultant-grade pre-built analysis templates
Version history
Track changes with full version control
Shareable
Public links or embedded in NetSuite for team access
Start with best practices
20 dashboard templates and 150+ analysis playbooks, each with optimized SuiteQL queries and analytical frameworks.
Cash & Liquidity
- Cash flow forecast
- AP cash management
- AR aging & collections
Revenue & Profitability
- Executive revenue overview
- Customer profitability
- Profitability analyzer
Cost & Spend
- Vendor scorecard
- Expense analysis
Operations
- Month-end close status
- Inventory health
- Sales pipeline tracker
Advanced
- KPI balanced scorecard
- Department performance
- Benchmark comparison
Risk & Compliance
- Fraud detection patterns
- SOD violation scanner
- Audit trail reports
Predict what's next
Statistical and driver-based forecasting with scenario modeling, confidence intervals, and sensitivity analysis.
{
  "scenario": "base",
  "growth_rate": 0.12,
  "include_pipeline": true,
  "horizon_weeks": 13,
  "covenant_floor_m": 3.5,
  "as_of": "2026-07-05"
}import pandas as pd
from nsgpt.forecast import cash_model
wk = cash_model(scenario="base", growth=0.12,
include_pipeline=True, horizon=13)
wk.plot_band(covenant_floor=3.5) # projected cash + 80% CIProjected cash dips to $3.80M in Week 7 — within $300K of the $3.5M covenant floor. The drop is driven by the annual insurance premium landing in the same week as payroll.
Base case clears the covenant every week, but Week 7 is the pinch point. Deferring the premium two weeks lifts the trough back above $4.0M and restores ~$300K of headroom.
Revenue forecasting
Analyzes 36 months of history, models seasonality indices, provides confidence intervals.
Rolling forecasts
12-18 month rolling forecasts with driver-based models and MAPE accuracy tracking.
Cash flow projection
13-week rolling forecast with probability-weighted collections by aging bucket.
Scenario modeling
Bear/base/bull cases with sensitivity analysis from -20% to +20% across revenue, costs, and headcount.
Breakeven analysis
Contribution margin analysis with sensitivity to price, volume, and cost changes.
Variance analysis
Automated budget vs actual comparison with drill-down into material variances and root cause identification.

No-code analytics for the whole team
Natural language queries
Ask questions in plain English, get visualizations
No-code dashboard builder
Drag, drop, publish
Smart alerts
Configurable threshold notifications across any metric
Collaboration
Share, comment, and iterate on analysis as a team
See analytics in action
Book a personalized demo to see workbooks, dashboards, and forecasting powered by your NetSuite data.